- (*)Identities about projection:
- Prove that the angle between two vectors $\mathbf{x}$ and $\mathbf{y}$ is $\cos^{-1}\frac{\mathbf{x}^T\mathbf{y}}{\|\mathbf{x}\|\|\mathbf{y}\|}$.
- Prove that the projection of vector $\mathbf{x}$ onto vector $\mathbf{y}$ is $\frac{\mathbf{x}^T\mathbf{y}}{\|\mathbf{y}\|}$.
- (*)About PCA:
- What is the goal of PCA?
- Please write down the objective function of PCA.
- Please derive the first principal component of PCA.
- Please derive the second principal component of PCA.
- (**)Properties of symmetric square matrices:
Prove the following properties of symmetric square matrices:
- A square symmetric matrix have orthogonal eigenvectors corresponding to different eigenvalues.
- (*)About PCA computation: If A is a 10000-by-400 real matrix. Explain how you can compute the 400 largest eigenvalues (and the corresponding eigenvectors) of AA' without computing AA' in advance.
- (*)The shortest distance between a point and a line in 2D: Prove that the shortest distance between a point $(x_0, y_0)$ and a line $ax+by+c=0$ in a 2D space is $\frac{|ax_0+by_0+c|}{\sqrt{a^2+b^2}}$.
- (*)PCA for line fitting of total least-squares in 2D:
Given a dataset of X-Y pairs $\{(x_i, y_i)|i=1, \dots, n\}$, the goal of total least-squares estimate is to find a line $ax+by+c=0$ such that the sum of shortest squared distances of all points to the line is minimized. The objective function can be expressed as
$$
J(a, b, c) = \sum_{i=1}^n \frac{\left(ax_i+by_i+c\right)^2}{a^2+b^2}
$$
Prove that the line must cross the dataset's mean point $\left(\mu_x, \mu_y\right) = \left(\frac{\sum_{i=1}^n x_i}{n}, \frac{\sum_{i=1}^n y_i}{n} \right)$.
Hint: $\frac{\partial J}{\partial c}=0$. - (*)The shortest distance between a point and a plane in 3D: Prove that the shortest distance between a point $(x_0, y_0, z_0)$ and a plane $ax+by+cz+d=0$ in a 3D space is $\frac{|ax_0+by_0+cz_0+d|}{\sqrt{a^2+b^2+c^2}}$.
- (*)PCA for plane fitting of total least-squares in 3D:
Given a dataset of X-Y-Z points $\{(x_i, y_i, z_i)|i=1, \dots, n\}$, the goal of total least-squares estimate is to find a plane $ax+by+cz+d=0$ such that the sum of shortest squared distances of all points to the plane is minimized. The objective function can be expressed as
$$
J(a, b, c, d) = \sum_{i=1}^n \frac{\left(ax_i+by_i+cz_i+d\right)^2}{a^2+b^2+c^2}
$$
Prove that the plane must cross the dataset's mean point \[ \left(\mu_x, \mu_y, \mu_z\right) = \left(\frac{\sum_{i=1}^n x_i}{n}, \frac{\sum_{i=1}^n y_i}{n}, \frac{\sum_{i=1}^n z_i}{n} \right) \].
Hint: $\frac{\partial J}{\partial d}=0$. - (*)The shortest distance between a point and a line in 3D space: Prove that the square of the shortest distance between a point $(x_0, y_0, z_0)$ and a line $\frac{x-p}{a}=\frac{y-q}{b}=\frac{z-r}{c}$ in a 3D space is $(x_0-p)^2+(y_0-q)^2+(z_0-r)^2-\frac{\left[a(x_0-p)+b(y_0-q)+c(z_0-r)\right]^2}{a^2+b^2+c^2}$.
- (*)PCA for line fit of total least-squares in 3D:
Given a dataset of X-Y-Z points $\{(x_i, y_i, z_i)|i=1, \dots, n\}$, the goal of total least-squares estimate for a line is to find a line $\frac{x-p}{a}=\frac{y-q}{b}=\frac{z-r}{c}$ such that the sum of shortest squared distances of all points to the line is minimized. The objective function can be expressed as
$$
J(p, q, r, a, b, c) = \sum_{i=1}^n \left\{ (x_i-p)^2+(y_i-q)^2+(z_i-r)^2 - \frac{\left[ a(x_i-p)+b(y_i-q)+c(z_i-r)\right]^2}{a^2+b^2+c^2} \right\}
$$
(See the previous exercise.) Prove that the line must cross the dataset's mean point \[ \left(\mu_x, \mu_y, \mu_z\right) = \left(\frac{\sum_{i=1}^n x_i}{n}, \frac{\sum_{i=1}^n y_i}{n}, \frac{\sum_{i=1}^n z_i}{n} \right) \].
Hint: $\frac{\partial J}{\partial p}=\frac{\partial J}{\partial q}=\frac{\partial J}{\partial r}=0 \Rightarrow \frac{\mu_x-p}{a}=\frac{\mu_y-q}{b}=\frac{\mu_z-r}{c}$ - (*)Difference between LSE and TLS: What is the key difference between LSE (least-squares estimate) and TLS (total least-squares)?
- (*)Strength and weakness of TLS: Please give the strength and weakness of TLS (total least-squares) when compared with the common LSE (least-squares estimate).
- (*)Function for line fitting via TLS:
Write a function that performs TLS for line fitting, with the following usage:
coef=lineFitViaTls(data) where- data: A 2-row data matrix with row 1 as the x and row 2 as the y.
- coef: A 3-element column vector of the coefficients [a, b, c] of the fitting line $ax+by+c=0$, satisfying $a^2+b^2=1$. (Note that in order to make the identified coefficients unique, the first non-zero coefficient must be positive.)
You can download the p-file lineFitViaTls.p to test your function. Here is a test case to show the difference between TLS and LS:
- (*)Function for plane fitting via TLS:
Write a function that performs TLS for plane fitting, with the following usage:
coef=planeFitViaTls(data) where- data: A 3-row data matrix with row 1 as the x, row 2 as the y, and row 3 as the z.
- coef: A 4-element column vector of the coefficients [a, b, c, d] of the fitting plane $ax+by+cz+d=0$, satisfying $a^2+b^2+c^2=1$. (Note that in order to make the identified coefficients unique, the first non-zero coefficient must be positive.)
You can download the p-file planeFitViaTls.p to test your function. Here is a test case:
- (*)Function for hyperplane fitting via TLS:
Write a function that performs TLS for hyperplane fitting, with the following usage:
coef=hyperplaneFitViaTls(data) where- data: A $d$-row data matrix with row 1 as the $x_1$, row 2 as the $x_2$, and so on.
- coef: A ($d+1$)-element column vector of the coefficients $[a_1, a_2, \dots a_d, a_{d+1}]$ of the fitting plane $a_1x_1+a_2x_2+\cdots+a_dx_d+a_{d+1}=0$, satisfying $\sum_{i=1}^{d}a_i^2=1$. (Note that in order to make the identified coefficients unique, the first non-zero coefficient must be positive.)
You can download the p-file hyperplaneFitViaTls.p to test your function. Here is a test case:
Note that hyperplaneFitViaTls.m is more general and it should be used to replace lineFitViaTls.m and planeFitViaTls.m in the previous two exercises.
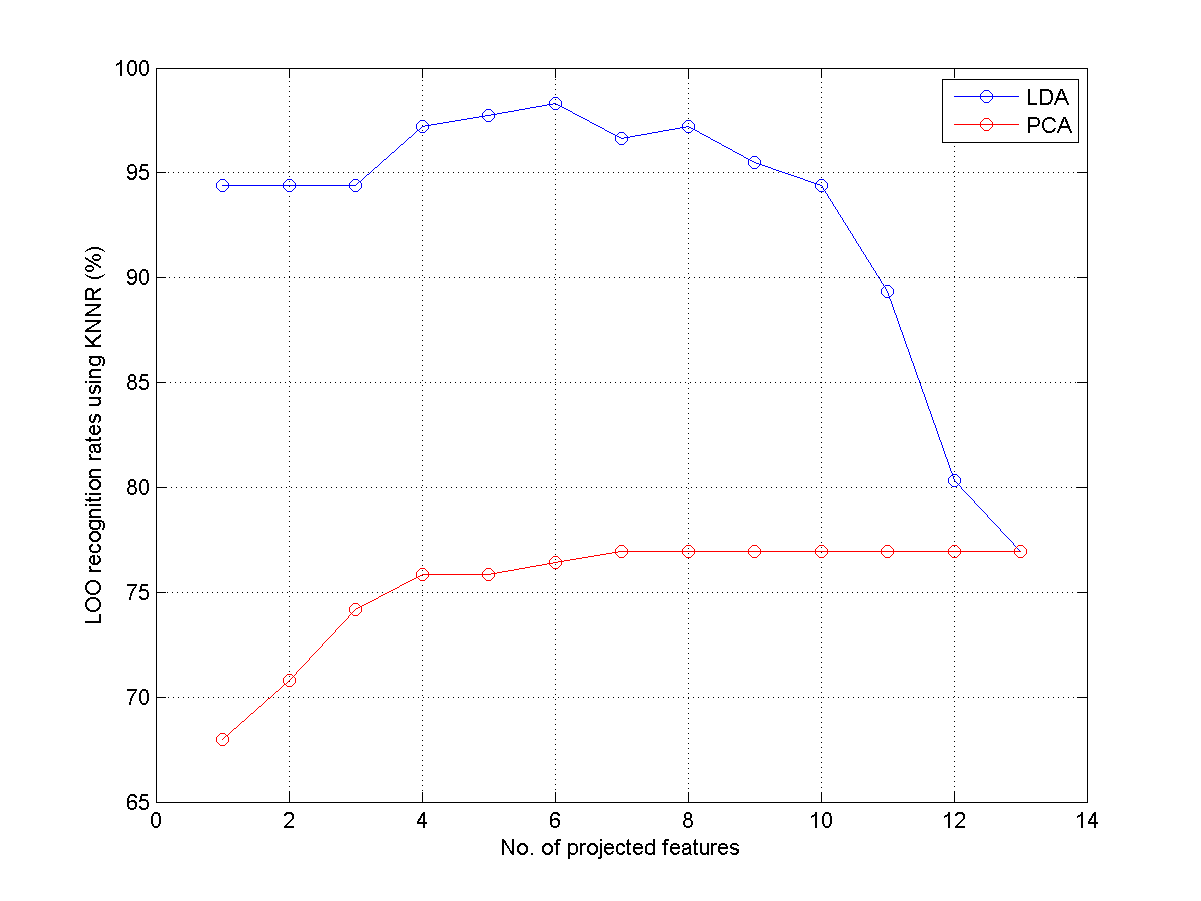
- (*)比較LDA和PCA對於WINE辨識率的影響:
請寫一個程式 ldaPcaWineDim01.m,畫出兩條曲線,顯示在使用 LDA 和 PCA 時,辨識率(使用 KNNC 及 leave-one-out)對於資料維度的圖形。所畫出的圖形應該類似下圖:
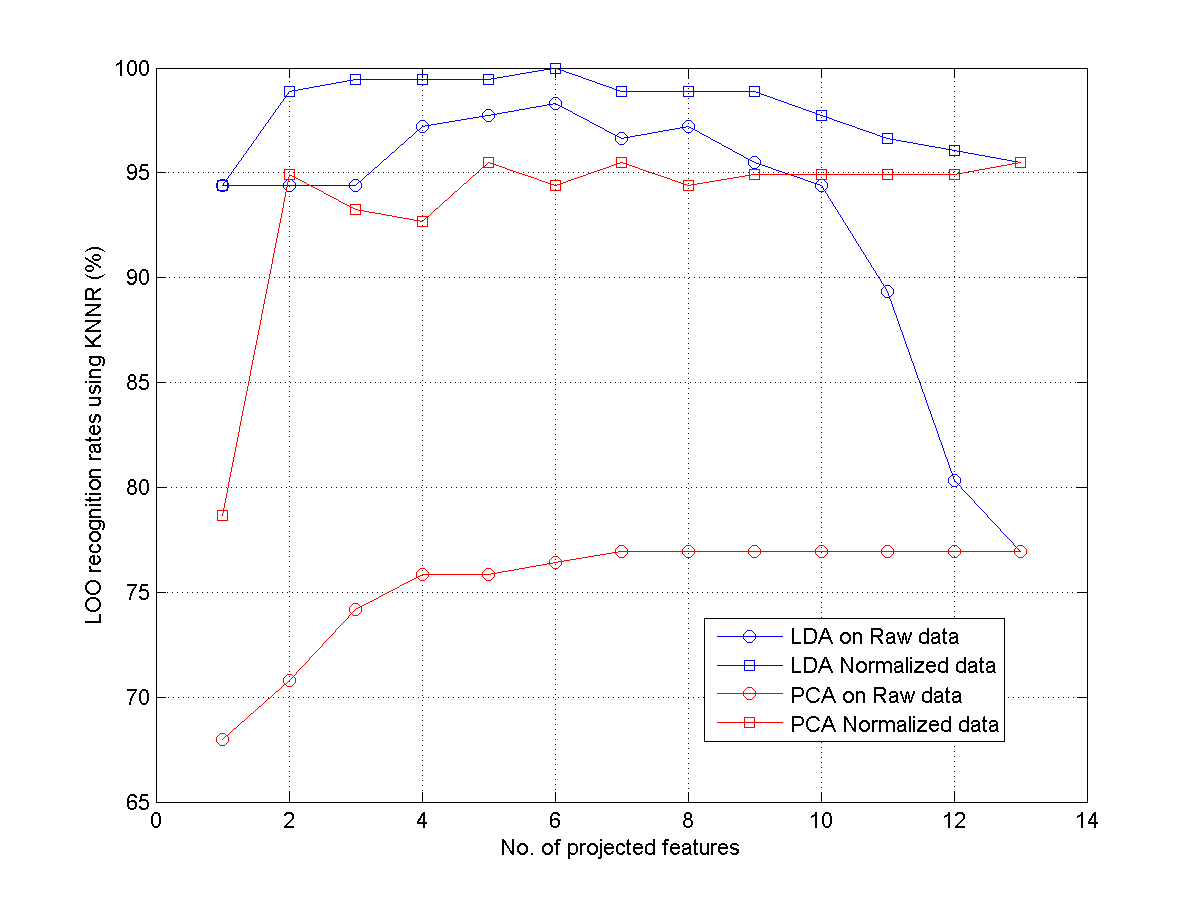
- (**)比較LDA和PCA對於WINE辨識率的影響:
請寫一個程式 ldaPcaWineDim02.m,畫出 4 條曲線,顯示在使用 LDA 和 PCA 時,以及是否使用資料正規化時,辨識率(使用 KNNC 及 leave-one-out)對於資料維度的圖形。所畫出的圖形應該類似下圖:
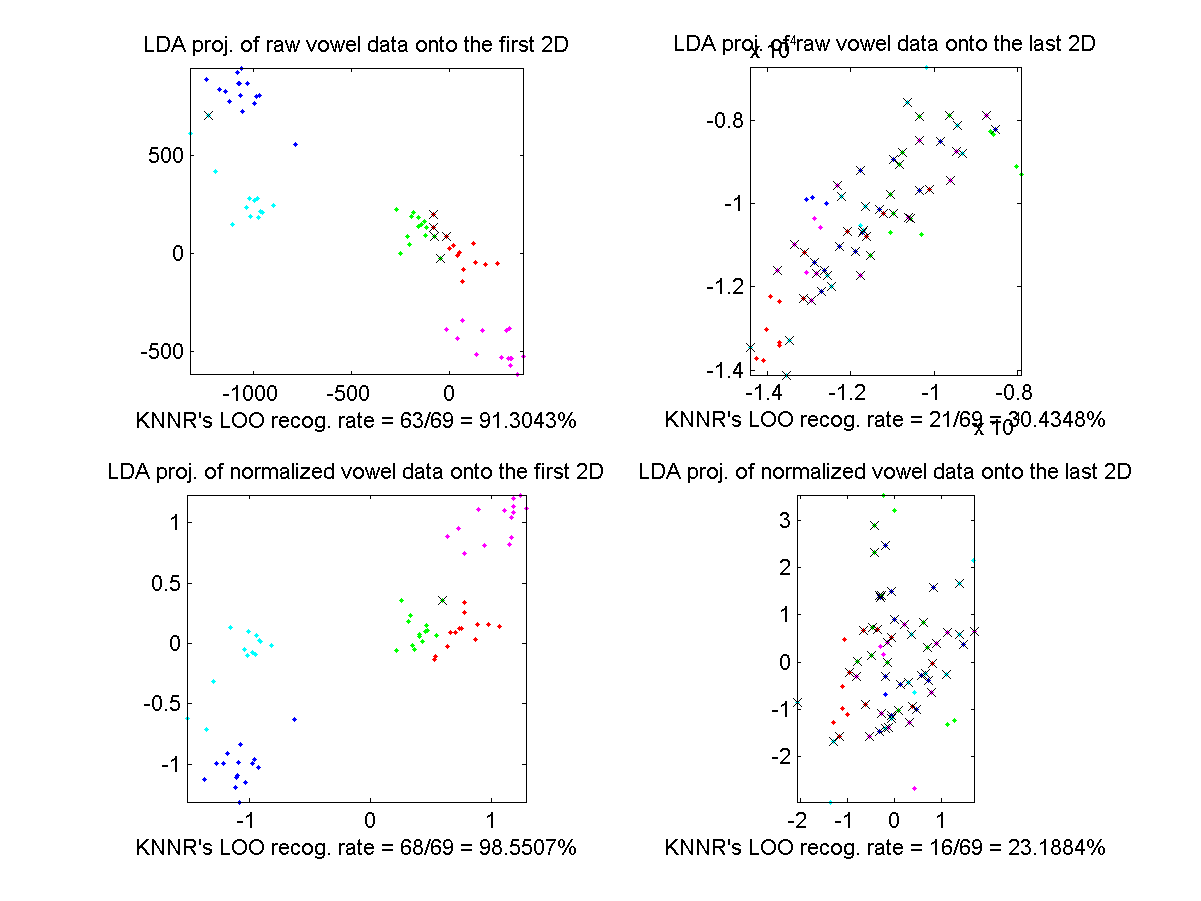
- (**)LDA用於母音資料的二維作圖:
請寫一個程式 ldaVowel2d01.m,使用 LDA 於此作業
「計算中文母音MFCC並進行分類」之母音資料,所用的語音特徵是12維的 MFCC,並畫出四個圖:
- 使用原始 MFCC 資料,投影於 LDA 前兩維。
- 使用原始 MFCC 資料,投影於 LDA 後兩維。
- 使用正規化後的 MFCC 資料,投影於 LDA 前兩維。
- 使用正規化後的 MFCC 資料,投影於 LDA 後兩維。
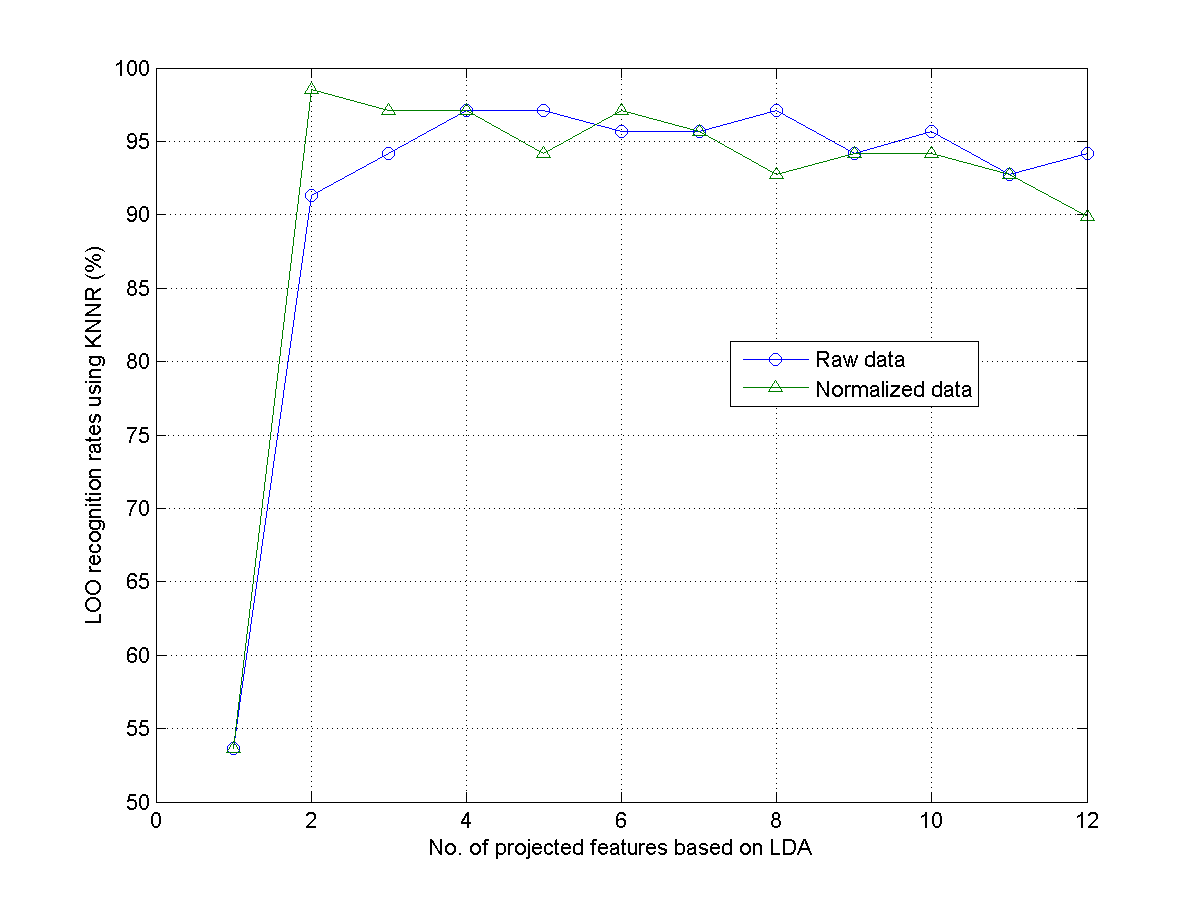
- (**)LDA用於母音資料並變化維度:
請寫一個程式 ldaVowelDim02.m,使用 LDA 於此作業
「計算中文母音MFCC並進行分類」之母音資料,所用的語音特徵是12維的 MFCC,並畫出辨識率(使用 KNNC 及 LOO)對 LDA 維度的曲線,應有兩條,代表使用原始及正規化之 MFCC 語音特徵。所畫出的圖形應該類似下圖:
- (**)LDA用於母音資料並變化維度:
請寫一個程式 ldaVowelDim03.m,重複上題,但改用不同的語音特徵,看看是否能夠提高辨識率:
- MFCC & log energy(共 13 維)。
- MFCC & log energy, and their delta(共 26 維)。
- MFCC & log energy, and their delta, and delta delta(共 39 維)。
- (*)PCA for face recognition: Describe the basic steps of using PCA for face recognition. In particular, please explain what eigenfaces are and how they are used in the PCA-based approach.
- (*)Display misclassified face images:
In this example, we use PCA to obtain a recognition rate of 98.75%.
- Display the misclassified 5 face images and their top-3 nearest neighbors.
- Repeat part (a) using images after PCA+LDA projection.
- (**)Feature selection after PCA for face recognition:
PCA selects the principal components that explain the total variance most after projection. However, sometimes the variations are mostly due to lighting instead of differences among individuals. As a result, it becomes necessary to perform feature selection after PCA projection. This exercise explore such possibility by perform the following feature selection schemes after PCA projection.
- Sequential feature selection.
- Exhaustive feature selection. (Please limited the number of selected features based on your computer's capability.)
- (**)Class-specific PCA for face recognition: In this example, we use PCA to obtain a recognition rate of 98.75%. However, the projection is based on face images of all classes. Is it possible to have class-specific projections to have a better accuracy? Please design code to report your results and support your claims along this direction.
Data Clustering and Pattern Recognition (資料分群與樣式辨認)
